Screen Time circa 2015
Adolescent screen time circa 2015 was dominated by viewing entertainment and playing games -- not by the time spent on social media sites like Facebook and Instagram.
We previously found that in 2015 most teenage girls spent no more than an hour daily on social media sites like Facebook and Instagram (see Social Media Time circa 2015).
We will now look at how time spent on social media sites by teens (and oldest preteens) compared with their other screen activities in 2015.
Note: new readers please also see Social Media and Time Displacement (Haidt's After Babel) to understand how this article fits into my criticism of Jonathan Haidt regarding his (in my opinion) unrealistic presumptions about the time spent by teenage and even preteen girls on social media being the primary culprit in the displacement of beneficial ‘real life’ activities.
Common Sense Census
As before, we will use the Common Sense Census of 2015, titled MEDIA USE BY TWEENS AND TEENS, which queried more than 2,600 youths aged 8 to 18 (partitioned by the report into Tweens aged 8-12 and Teens aged 13-18).
The survey included questions about time spent the day before doing activities such as playing computer games (on all kinds of devices) and viewing TV or online videos.
Note that the survey took place over a whole month balanced between the days of the week, and so it takes into account weekends (and some of the more extreme amounts of reported screen time could have been due to the youth dedicating the weekend to gaming or to binge watching).
Note also that some screen time may have been duplicated — in particular parts of social media time may have been also counted as playing games or watching videos (e.g. both have been prominent features of Facebook). For this reasons the screen time totals in the report might be somewhat greater than actual screen time — an issue that we will ignore here because we need only ballpark estimates for now to compare social media time with other screen activities.
Tweens
From Table 15 of the report we can chart the screen time of kids aged 8-12 as follows:
Note: The Other category is mainly browsing the web and communicating (e.g. instant messaging).
Clearly the time spent on social media by kids aged 8-12 was very small compared to their other screen activities.
Teens
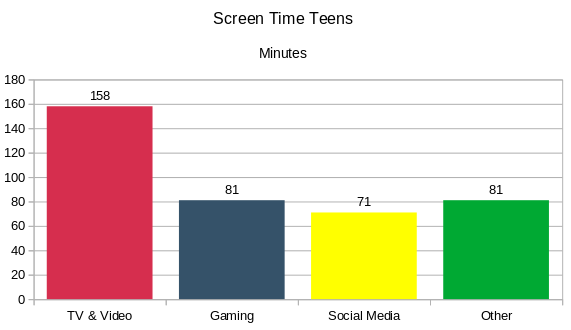
From Table 15 we can chart the screen time of teens aged 13-18 as follows:
Although social media time was a substantial portion of screen time for teens, it still constituted less than 20% of overall screen time.
Teen Girls
The Common Sense report specifies time spent by teen girls only for social media and gaming, the former used much more by girls (52 vs 92 minutes) and the latter much more by boys (121 vs 39 minutes). The report does state that overall screen time is similar for boys and girls, meaning that the average 92 minutes spent by teen girls on social media amounted to less than a quarter of all screen time.
Time Displacement
Displacement of beneficial ‘real life’ activities (such as socializing in-person with peers or being physically active outdoors) by screen time encompasses two related yet distinct issues: individual impact and environmental impact.
Even teens who spend little time on screens have lowered opportunities to socialize with peers in person and outdoors if most of them spend much more of their free time with screens. Average times are the best indicators of such environmental impacts because they show how much time has been removed from opportunities for ‘real life’ peer activities such as playing with friends outdoors.
The results of the 2015 census make it clear that social media like Instagram and Facebook were substantial but much smaller environmental factors when compared to the time spent viewing entertainment.
Individual impact is best measured by excessive screen time. The evaluation of individual impact, however, is difficult here because the Common Sense report omits a lot of important information (such as excessive screen time percentages for each category and gender or separate data for weekdays and weekends) and because some screen times may have been counted twice.
Despite these limitations it is safe to say that, even among teenage girls, excessive time (> 2 hours daily) spent using social media is less common than excessive time spent watching TV and videos (which affected about 30% of girls — see Notes).
Conclusion
Teens in 2015 spent most of their screen time watching commercial entertainment (movies, television serials, music videos) on TV and other devices (such as via Netflix or YouTube) and playing games on consoles, computers, and mobile devices. The time spent on social media by teen girls was less than a quarter of their overall screen time.


