Misrepresentation of Severe Depression (Facebook Expansion Study)
The misrepresentation of depressive episodes as severe depression is misleading and verges on absurd when the prevalence of 'severe' depression is more than double that of ordinary depression.
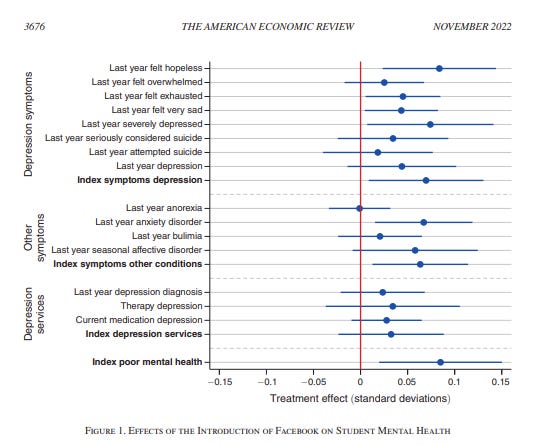
According to the results of the Social Media and Mental Health paper (SMMH) studying the impacts of the Facebook expansion 2004-05 on college student health, the effects appear stronger for severe depression than for ordinary depression:
While confidence intervals for “Last year depression” include no effect, those for “Last year severely depressed” manage to (barely) evade zero and the effect size (measured in standard deviation) is nearly double that for depression (0.07 vs. 0.04 — see Table A.4 in SMMH).
The authors highlight the effect on severe depression when they note:
The effect on severe depression is similar in magnitude to the effect observed in Allcott et al. (2020) on whether a respondent felt depressed in the past month (0.07 versus 0.09 standard deviations, respectively).
These reports naturally suggest that the relative impact on the prevalence of severe depression must have been considerably larger than on regular depression, which the authors approximate as a 8% increase (2 p.p.) over a baseline of 25%. For example, if severe depression prevalence baseline was 15%, even a 3 p.p. increase would amount to a 20% relative increase.
The authors, however, do not offer any prevalence data for severe depression.
What Severe Depression?
It turns out that what the authors term ‘severe’ depression is not severe depression by any reasonable definition. In reality, it is what psychologists might call a minor depressive episode, which is far more common than outright depression.
For example, in the fall 2004 NCHA results, last year prevalence was 18.5% for depression and 43.5% for depressive event (misreported as ‘severe’ depression by the authors).
Furthermore, the prevalence of Major Depressive Episode (MDE) per NSDUH surveys was about 8% in late 2000s; the prevalence of Major Depressive Episode with Severe Impairment was even smaller (see Did Severe Depression Increase Among Teens?).
Finally, per Table A.31 the scale of the ‘severe’ depression variable is actually an ordinal indicating frequency — it is not dichotomous (see Notes). This raises validity concerns about comparisons with effects on other types of outcome (e.g. “Last year depression” is indeed dichotomous).
The Boiled Universe
How could the authors have missed that their ‘severe’ depression had prevalence more than double the prevalence of regular depression?
The answer may be the almost complete absence of any ‘raw’ data in the paper — that is data in original units. We saw in Facebook Expansion: Invisible Impacts? that the authors omitted any and all mental health trends before 2008, and that this rendered readers blind in regards to the full context of the SMMH study.
Had the authors simply provided a table with prevalence values of symptoms, one of the authors, or at least an editor or a reviewer, would have noticed that ‘severe’ depression is far more common than plain depression.
Blind reliance on ‘cooked’ data, such as z-scores, and ‘boiled’ data, such as SD effects in complex regressions, can render everyone blind.
Conclusion
The misrepresentation of depressive episodes as ‘severe’ depression in Social Media and Mental Health is not only misleading but raises concerns as to what else has been misinterpreted due to all the omissions of crucial data (and perhaps also due to a lack of involvement by psychologists at any stage).


